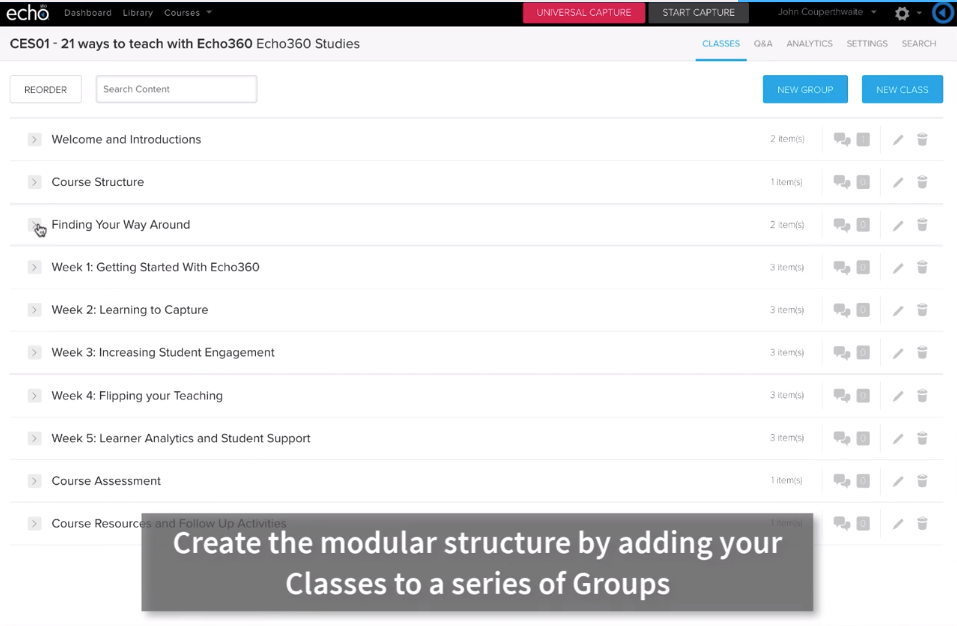
21 Ways to Teach with Echo360 | Using Learning Analytics During my Class
Why should I use learning analytics during my class?
Whilst there is much talk about big data, there is little said about the practical uses of analytics for teaching staff to support in-class teaching and flipped learning activities. Having the data easily available can give real-time confirmation that what you are teaching is being understood by all the class, that all your class are listening, responding and learning, and conversely, whether any of your students are confused at any stage. Such rich feedback can make a real difference in class: you can provide more immediate attention to difficult concepts; you can understand which students are consistently struggling or are absent in your classes, and you can receive quantitative feedback on how students have responded at each stage in your class.
Proactively using analytics in your teaching may take a little time to adjust to and requires careful consideration about when to interact with the data whilst actually teaching, but some small adaptations to your approach can help you be more responsive to your students’ learning needs. This post outlines several of the ways that you can access analytics to review in-class engagement; it also includes details on how you can interrogate the data from a flipped activity to inform your teaching in an in-class session.
How can I do that?
How well do you think your students understand everything you cover in class? Monitoring analytics and responding to them can make a difference by addressing individual and group responses in a timely and appropriate way. We have therefore built the analytics into the classroom tools, allowing you to teach AND monitor at the same time.
How confused are your students?
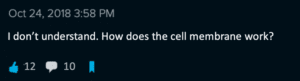
As a learner being confused in class is very frustrating. It means that much or all of the teaching that follows doesn’t make any sense and is a waste of precious time. However, with Echo360, students can click when they are confused on any slide; this information is anonymised, added to any alerts for that slide from other students and made visible to you, the teacher.
Having only one confused student at any stage perhaps deserves attention after class, but if 50 from your class of 100 say they are confused then you can choose when to intervene. Most teaching staff would leave this until shortly before the end of a class, but if time permits then it is best addressed as soon as possible, requiring regular checking.
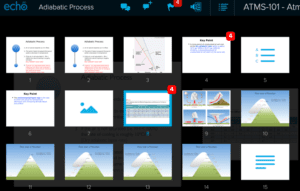
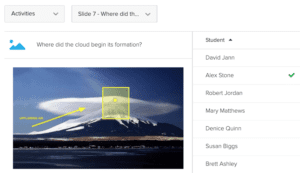
How can you do this? First, upload your slides into Echo360 prior to class and invite students to click through them as you teach. Students should be instructed in both when to use the ‘confusion flag’ and how you intend to respond to it. Second, you open up the same file in Echo360 and teach. As you are teaching, you will see a red number indicator appear if students are confused; the number relates to the number that are confused for that particular slide. To check the level of confusion across all your slides, click on the ‘matrix’ button to reveal a thumbnail of all your slides; all red indicator numbers will appear alongside each of the slides.
What can your polls tell you about your students?
Running a poll during class offers vital feedback for both the learners and for you, the teacher. Students can check their understanding of key concepts and compare themselves against the rest of their cohort. For teachers, you can quick evaluate whether the majority of your class have understood a concept, for example, and can immediately address it with a follow question, or by inviting them to discuss with a neighbour and vote again.
Adding polls to your presentation slides is very straightforward in Echo360. Check out earlier posts on ‘Increasing student engagement: creating student polls, questions and other activities’ and ‘Flip your teaching with interactive presentations’ to learn how you can use these polls to change the dynamic of your classes.
How can I learn more from in-class discussions?
Enabling the Echo360 Q&A tool during your classes allow you to, a) post questions before class for your students to respond to, or b) encourage a synchronous channel of conversation between your students whilst you teach. See ‘Viewing classroom content’ for more information about the Q&A tool. This has real advantages for educators as Dr Pope at the University of Adelaide notes “…in large classes where you can see a sea of faces, you can ask if there’s any questions and you get no hands but with Echo360 the students do respond. I can see whether they understand it and we can go on or whether we need to stop and work on that concept some more.”
Analytics are instantly updated within the Q&A tool, giving educators immediate feedback during class. Each question includes the number of student ‘endorsements’ and the number of responses from the cohort (see below). Armed with this information, the educator can learn from the endorsements how many other students would like an answer to the question, and the volume of comments can indicate how important the question is to them. The educator may perhaps respond by encouraging others to post their own answers, or may directly respond to the question verbally and invite other verbal comments from the students.
What is the overall level of engagement of the class?
When teaching a class it can be difficult to know how many have attended, how many are actively involved, and if any particular students are struggling. However, when using the engagement tools in Echo360 during class, you can access realtime information on all these areas, and more, with just a couple of clicks away from your presentation. This might take some practice at first, and you would probably want to mute the projector, but using natural breaks in a class to assess this information can could make a real difference to the impact of your teaching and the support you can offer to all your students.
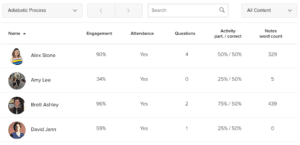
The engagement analytics are available on your Section home page and provide a live snapshot of all the cohort analytics across each of the different classes. For example, a tabular summary of the analytics of your individual students for your class can used to monitor the overall level of engagement of the whole cohort, and include details on individuals if you wish to provide some personal support. Further information on what is available and how to access it is available in ‘Viewing Student Analytics Data’.
What can I learn from the flipped activity analytics?
As we all know, in-class sessions with students following a flipped learning activity can be incredibly difficult if your students have completed the task(s). It is often challenging to check whether all your students have completed and understand if there are any particular learning points that you wish to review. With Echo360 analytics, all of this information is available to access anytime after the activity is made available. This means that educators can evaluate who has logged into the activity, how much each student has completed, what responses they gave to questions, and what questions or responses they posted.
Not only is this information helpful for the in-class session, but demonstrating that the activity is being monitored can have a surprisingly positive impact on future activity engagement rates! Similarly, these analytic charts can be used as a formative teaching tool during class owing to the rich information that is available in the activity reports. Check out a previous blog post on ‘Flip Your Teaching with Interactive Presentations’ to learn more about flipping your teaching in this way, or learn how to create your own at ‘Adding interactive slides to a presentation’.
Anything else I should be aware of?
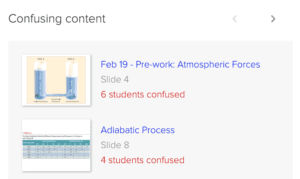
It is not only during your class that you can be alerted to your students’ confusion to any of your activities or recordings. The confusion analytics are available on any slides and polling activities that are released, before or after class; students can also add confusion alerts to any moment in a class recording. This information is available to view within any Class resource, or in the Analytics page.
It is sort of obvious, but the Analytics data can only provide helpful information about your student IF they are using the tools. Two ways to ensure you can capture data for ALL your students are, 1) ensure they are all registered for your Echo360 course – see ‘Inviting students to a course’ for more details – so even if they don’t do anything in your classes, their record will be stored and it will show an absence of any interactions; and, 2) give your students time to access the Echo360 tools early in your courses, perhaps as an icebreaker question in each class, to ensure they can confidently use Echo360 and they are encouraged to interact.
Does it work?
There is perhaps nothing new in receiving qualitative or quantitative feedback from your students during class. We all know it is relatively easy to have group conversations, a show of hands, a register of attendance, even use digital tools to deliver polling questions and surveys. However, what is new about monitoring live analytics during class in the way is how numerous sources of information can be viewed concurrently, how there is a synergy between what you are teaching (slides, discussions, surveys) and the data being retrieved, and how your attention can be quickly shifted between monitoring the whole group to checking on an individual student’s data.
Results from the Peer Instruction approach (Mazur, 1996), and others, have highlighted the potential for group learning, and critically, the teacher’s understanding of their group’s learning, through simple polling tools and transparent reporting of results. This approach amplifies both the volume and quality of information available to the teacher, empowering them to gain a more holistic understanding of their class, particularly when covering foundation topics and key concepts which are essential to building subsequent knowledge and skills.